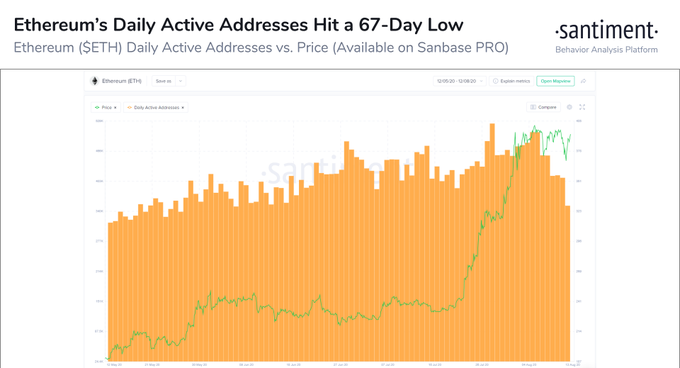
The start of the new week spelled misery for the world’s largest altcoin as prices plummeted to 14-day lows. Ethereum’s drastic price action was replicated across all indicators as well with a majority of them siding with the bear. At the time of writing, Ethereum was trading just above the $2000 mark.
The cryptocurrency’s current price hold came at a time when organizations were building new products on the Ethereum platform. India-based CoinDCX recently launched an Ethereum backed token called Liqueth with the intention of making staking accessible to all. Speaking about its latest token, CoinDCX CEO and co-founder Sumit Gupta stated:
“We want to make staking very simple and accessible for our users, which is why we are providing an ETH staking facility to anyone who holds at least 0.1 ETH in their CoinDCX wallet. Ultimately, we believe that this will allow our users to unlock the full earning potential of digital assets—by more actively participating in the token economy and the DeFi space.
Ethereum 1 hour:

Ethereum’s hourly charts showed signs of the bear’s arrival in the market. After having enjoyed the near $2500 range this month, the cryptocurrency was currently holding immediate support of $1992. Meanwhile, the immediate resistance clocked in at $2398 after which Ethereum dipped sharply.
The RSI surged back into the oversold zone post crashing below it on the 12th. This was a sign that users were buying back into the Ethereum market despite the red streaks on the chart. According to the Chaikin Money Flow, the capital coming into the Ethereum ecosystem had drastically reduced compared to the outflow.
The upper and lower Bollinger bands had converged towards one another indicating a price settlement.
Ethereum 1 day:

This year has been nothing short of dynamic for the altcoin. After the surge in May, a massive price correction brought Ethereum to its current level of $2014.
The CMF in the long term had turned for the worse but still stayed above the zero line. Reduced capital flow was imminent and if this continues, the outflow may overtake it soon.
Bollinger bands on the daily spectrum moved parallel to each other. An increased sell-off pressure may result in the upper band diverging from the lower band. The Relative Strength index fell below the zero line today as the selling pressure overtook the ETH buying pressure.


